Yesterday USA GDP data came which shows that it's consecutively second quarter in which USA economic is falling. This also speculate that FED will not raise interest rate sharply.
| USA GDP DATA | 2021-Q1 | 2021-Q2 | 2021-Q3 | 2021-Q4 | 2022-Q1 | 2022-Q2 |
|---|---|---|---|---|---|---|
| Growth Rate % | 6.3% | 6.7% | 2.3% | 6.9% | -1.6% | -0.9% |
Below is the chart of USA's major indices -
Here is the chart of USA major stock indices just to understand what is the and what will be the impact of this GDP data on USA's stock market.
Dow Jones -
Below is the technical chart of Dow Jones.
Here you can see dow jones took a support from Feb 2020's Corona top ~29570. And now it is at 32526 that mean nearly 10% up from lower levels.
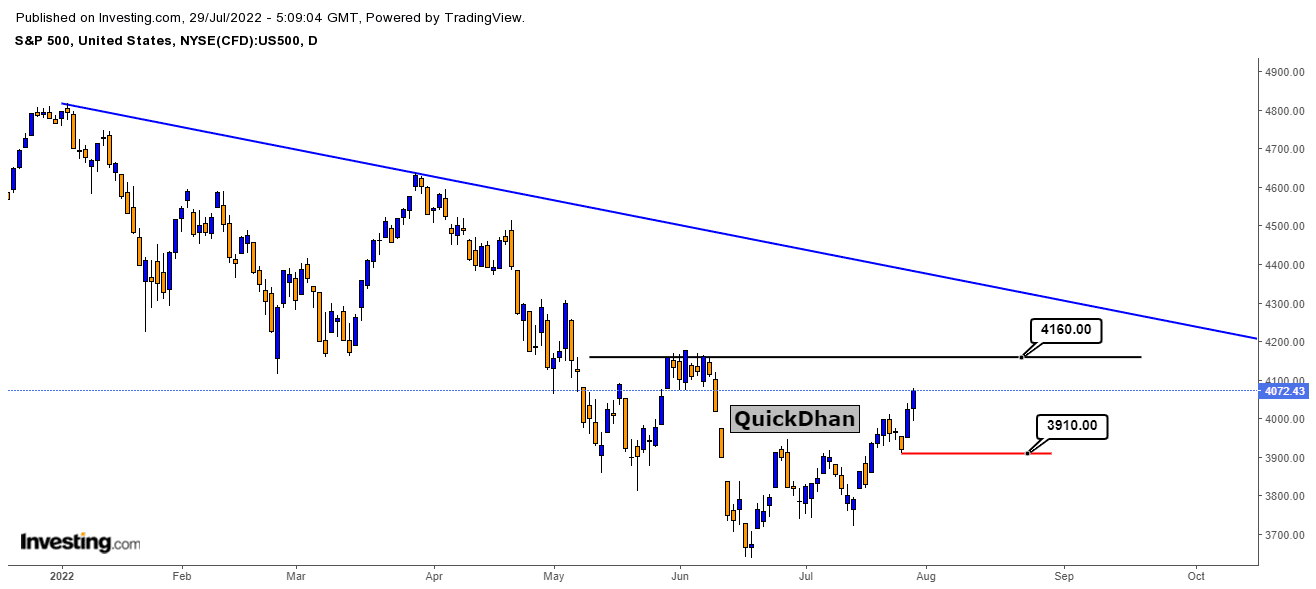
S&P 500 -
Below is the technical chart of S&P 500.
Nasdaq -
Below is the technical chart of NasDaq composite. In compare to above 2 chart Nasdaq composite is looking much stronger than other two. Nasdaq composite is near to it's breakout level which is at 12315.
Above 12315 we can expect targets of 12960, 13685 and 14500. But it will turn bearish if it close below 11533. Also consider this point into your analysis.
USA's Ecomony is in big trouble right now one side there is huge inflation in the country and another side is falling GDP data. FED wants to increase rates to curb inflation but can't raise sharply because of falling GDP data. This will be interesting to see how World biggest economy will come out of this situation.


